Supplemental Information for "Water-Splitting Photoelectrolysis Reaction Rate via Microscopic Imaging of Evolved Oxygen Bubbles"
Andrew J. Leenheer and Harry A. Atwater
California Institute of Technology
Journal of the Electrochemical Society
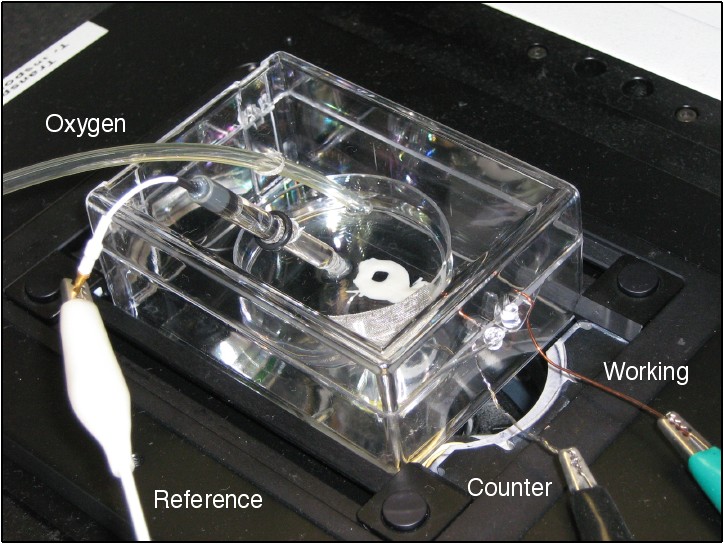
A picture of the enclosed electrochemical cell mounted on the inverted optical microscope is shown in Figure S1.
Figure S1. Picture of the experimental cell setup.
The oxygen flow tube and Ag/AgCl reference electrodes were introduced through the top of the plastic enclosure. Wires for the working and counter electrodes passed through the box seam. The white epoxy around the sample can be seen, but the platinum mesh counter-electrode is partly hidden.
As described in the paper, bubble growth on the strontium titanate photoanode was recorded using a camera connected to the microscope. To analyze the bubble growth rate, each video frame was analyzed using the procedure outlined in Figure S1.
Figure S2. Video processing workflow. (a) Extract movie frame, (b) threshold at a given darkness to create a binary image, (c) close the center hole via iterated opening and closing operations, (d) perform particle analysis to calculate bubble area and corresponding radius, (e) overlay the bubble perimeter on the original frame, increment the frame and repeat. Scale bar is 100 microns.
In the main text, the bubble radius was shown as a function of time in Figure 1. The video corresponding to that time series is shown in Movie S1 in AVI MPEG-4 format (or download here in Apple MOV QuickTime format), after the analysis of each frame has been performed. The radius of the red circle around the perimeter of each bubble was used to calculate the bubble volume.
Movie S1. Analyzed video corresponding to Figure 1 in the main text.